In the digital broadcast landscape, uptime is the primary currency of trust. When a stream drops, the first question is always: “Is it us, or the network?” For professional broadcasters, a single minute of “dead air” can lead to significant advertiser churn and listener abandonment.
This article demonstrates how traceroute and automated network telemetry can provide a “head start” on root-cause analysis (RCA), ensuring your broadcast remains “boringly reliable” even when incidents happen outside office hours.
Why RCA is Slow Without Technical Context
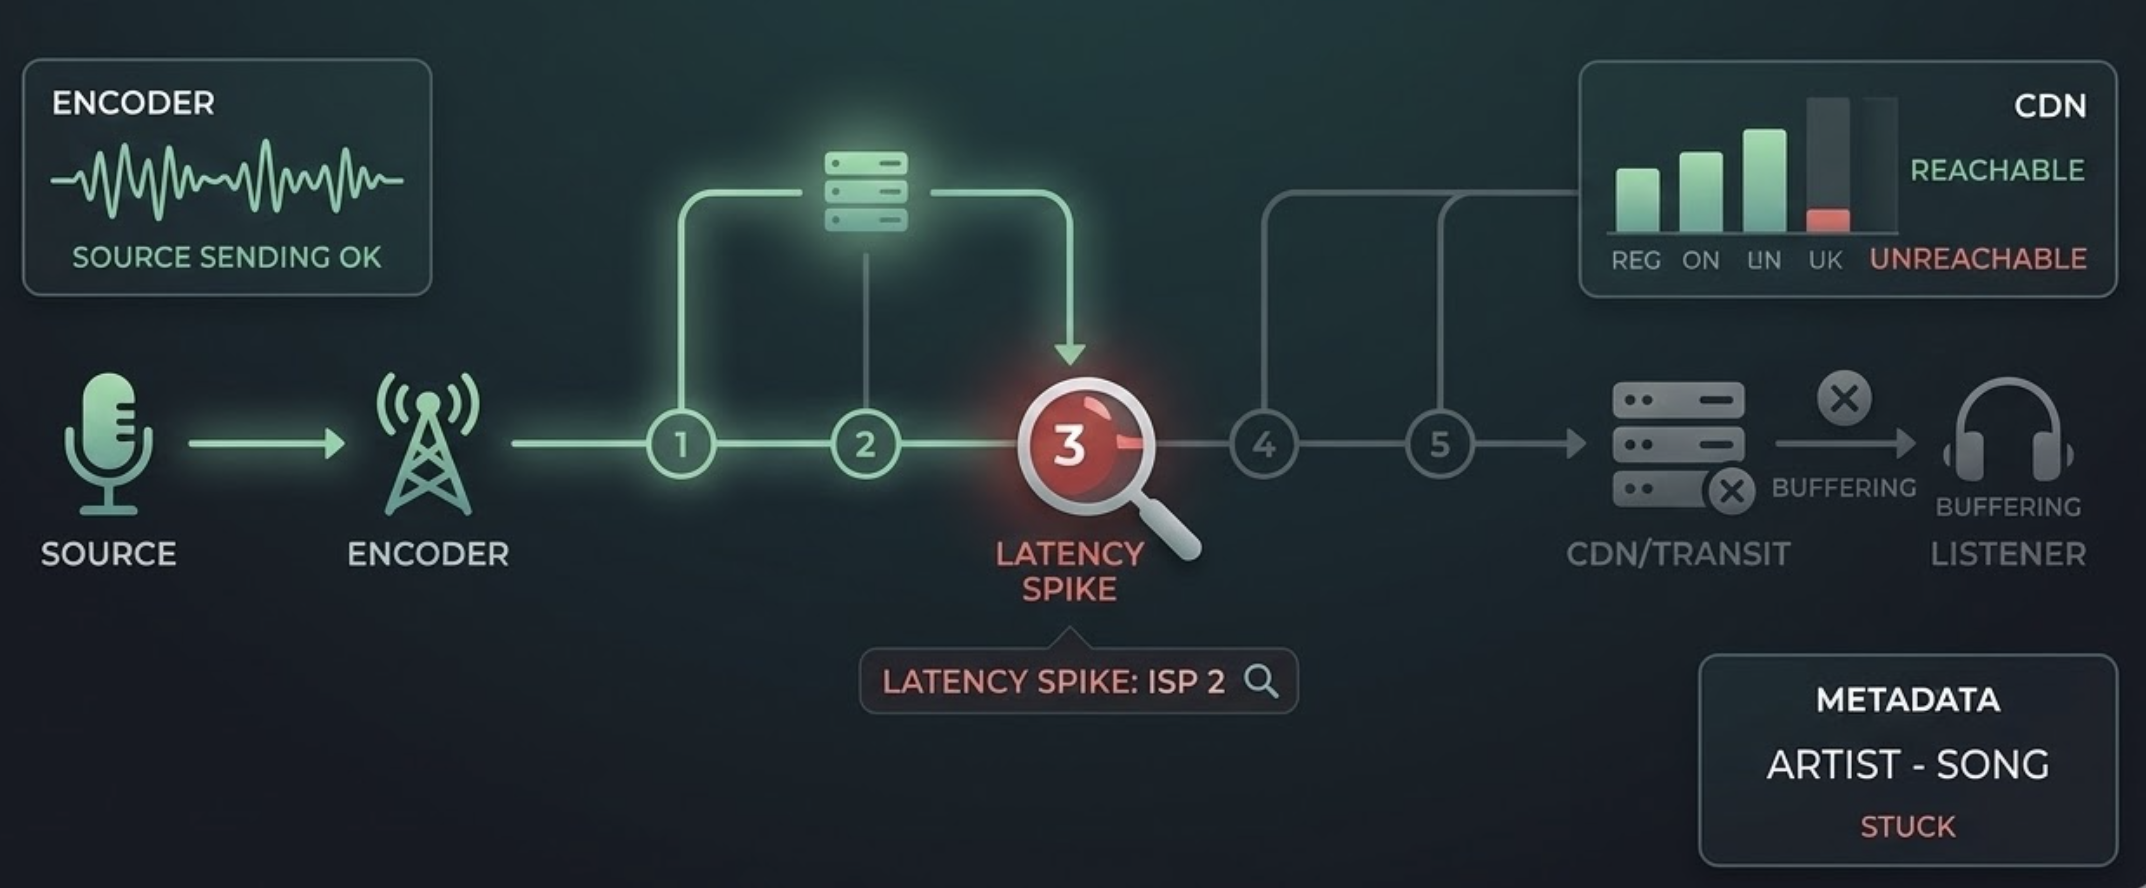
If your only data point is “the stream was down,” you are blind to the specific layer of failure. Professional monitoring must distinguish between:
- The Encoder/Source: Is the hardware sending data?.
- The Transport Level: For Icecast or Shoutcast, is the server maintaining a steady bitrate, or are there “Buffer too short” errors predicting an imminent crash?.
- The Metadata Level: If audio is present but “Now Playing” metadata has stopped, the issue is likely your automation system, not the network.
- The CDN / Transit Provider: Is the global distribution failing regionally?.
The Power of Traceroute for Broadcasters
Traceroute is a critical diagnostic tool used by industry leaders to verify service functionality from global nodes. By showing the hop-by-hop path to your server, it reveals:
- Latency Spikes: Exactly which router or ISP is introducing delay.
- Packet Loss: Identifying if data is being dropped at the edge server or deep within a third-party CDN.
- Routing Path Changes: Detecting if a “flapping” route is causing intermittent buffering for mobile listeners.
Practical RCA Workflow
- Instant Alerting: Trigger notifications based on configurable noise and duration thresholds (e.g., -45 dB for 30 seconds) to eliminate false alarms.
- Regional Confirmation: Validate the outage from a Global Node Network to determine if the issue is a local ISP problem or a total server collapse.
- Automated Diagnostics: The moment a failure is detected, the system should automatically run a traceroute and DNS lookup.
- Comparison and Audit: Compare the incident data against a “last-known-good” baseline and review recorded silence to audit exactly what went wrong.
- Documentation: Attach these findings to your incident ticket to give your IT or network team actionable data.
Patterns to Recognize in Network Telemetry
- ICMP Deprioritization: Loss at a single intermediate hop that doesn’t continue to the final destination is often just a router ignoring low-priority ping requests.
- Final-Hop Loss: Packet loss that persists to the destination indicates a real server-side or connection failure.
- Buffer Anomalies: Tracking “Buffer too long” or “too short” events can identify network congestion before the audio actually stops.
- Timestamp Glitches: In HLS streams, real-time debugging of DTS/PTS timestamps can reveal synchronization issues that mimic network dropouts.
Operational Tips for Maximum Reliability
- Maintain Baselines: Always keep a record of normal network paths for your primary and backup streams.
- Use Global Probes: Monitor from multiple continents to ensure your international audience isn’t facing regional blocks or latency.
- Store Logs for Audits: Retain logs for at least 30 to 90 days to track long-term uptime trends and SLA compliance.
Where Silencealarm Fits
Silencealarm is designed for the modern broadcaster who needs zero-friction, near real-time monitoring. By pairing “listener-impacting” alerts—such as dead air and connectivity loss—with automated network diagnostics, we help you move from legacy hardware monitoring to agile, cloud-based oversight.
Next step: Don’t wait for your listeners to tell you you’re off the air. Reduce your mean-time-to-diagnosis and secure your advertiser revenue at https://silencealarm.com.